Is AI the big user of energy or is it us?
AI and data centers have obviously been a huge talking point in the energy space. But what does it look like to look at the industry as a whole, the innovation of AI, and the impact on society as a point of view, rather than JUST the construction of data centers?
The growing pains of technology
At the beginning of computers, they used to take up entire floors of buildings, requiring massive cost, security that allowed only a few people to even be in the room, and it really was this “black box” where you added information on one side, and it spit out an answer on a tape at the other. If you were a betting person back then, it would have been a pretty safe bet to say that computers were never going to replace the room of people on typewriters, the room of switchboards for phones, and the ole’ pen and paper. Yet, here we are today with devices that can (mostly) fit in our pockets and are remarkably more powerful than any computer created back then, all while using less energy.
This is an important piece of context for today because we are seeing the same advancement happening with what has been coined as “Artificial Intelligence (AI),” which is really just marketing speak for Machine learning (ML), that also dates back to the earliest times of computers. Machine learning was a genuine curiosity about the capabilities of the technology that we could create. However, the limitation at the time was the technology itself. Today, the limitation is the amount of energy needed to solve a problem.
Just a few years ago, a query to an AI system would cost the same amount of energy as ten web searches (2.9 watt-hours). Of course, this was alarming and there was that classic tweet by Sam Altman where he tried to ask everybody to stop saying, “thank you” to ChatGPT.
But the rate of improvement has been accelerating at a pace that outpaces Moore’s Law and is now estimated to be 0.24 watt-hours, which is a 10th of the energy.
Why was Moore’s law significant?
Moore’s law was born out of the early semiconductor industry and, in 1965, it was predicted that the number of transistors on a chip would double every year with a minimal increase in cost for the next 10 years. What wasn’t predicted was that it would continue until around 2015. This is what enabled the technology revolution and the reason why we have the devices that we have today. It became affordable to actually scale technology and make it much more efficient.
As silicon got better (the newest AI chips do roughly 25x more work per watt than the generation before them), the models have improved (~3x per year) and how each request is handled, such as batching and caching, the current rate of technology has outpaced Moore’s law by roughly a thousandfold. So, what would take Moore’s law 20 years is being done in just one year. And, it is only accelerating. The technology industry was very accustomed to Moore’s Law as a way to anticipate the needs for business. But now, with everything moving incredibly quickly, it has caused companies to adapt and try to write a new playbook. While it is still being written, we are seeing the efficiency increase while demand is almost a vertical line.
How does all of this intersect with energy?
Energy is the only thing that either accelerates or decelerates this chapter of technology. Much like the efficiency of steam engines in England that ironically led to more coal consumption, AI is doing the exact same thing to our energy grid. While it is becoming more efficient by the hour, it is being outpaced by the demand of users. As a result, our energy grid is stressed (in addition to being old) and just doing more of what we have been doing isn’t necessarily the answer, it is more of a stop gap. That is why MYNT has been focused on building what the New Energy future can look like. It is cleaner, decentralized, MORE powerful, efficient, and accessible than ever before.
Similar to Moore’s law, there was another law called Wright’s law in 1936 that suggested that costs for production fall dramatically per the doubling of cumulative production. If you extrapolate that law to the clean energy industry, the economics are insane. Every doubling of solar module manufacturing has reduced the cost by 20%. Which might seem small. But when you do it for 40 years, it begins to change what the economics of energy could look like. Similarly, you can apply this to lithium-ion cells. What was $400 per kilowatt-hour in 2015 is around $95 today. With the cost of traditional energy generation methods increasing, and the aging infrastructure that it is built on, it seems like it is an excellent time for a rethink as to how energy is actually generated, stored, and distributed.
Energy consumption is only going one direction
Energy consumption has, and always will, go in one direction. It was a discussion back in the steam engine days, it was a discussion in the 70s, and it is still the same discussion today. For the first time, we actually have the capability and the technology to at least make energy much cleaner, while still being affordable. The reality is that a lot of energy is needed in everyday life, in addition to manufacturing and data centers. But, if we were just to focus on data centers, they were using around 1.5% of global energy (415 terawatt-hours). That is definitely not a small number but it is smaller than it is made out to be. It is forecasted by 2030 to be around 945 terawatt-hours.
That is more than doubling the consumption of only data centers. Now, before rushing to the conclusion of stopping construction of data centers, it is also pointing to the rapid growth of energy usage across every sector. The construction wouldn’t be needed if there wasn’t a demand for it. So, the thought process now becomes how do we actually meet that demand, and all of the other demands, in a clean and scalable way, rather than just stopping.
Two scenarios point to the same conclusion… clean energy is the way forward.
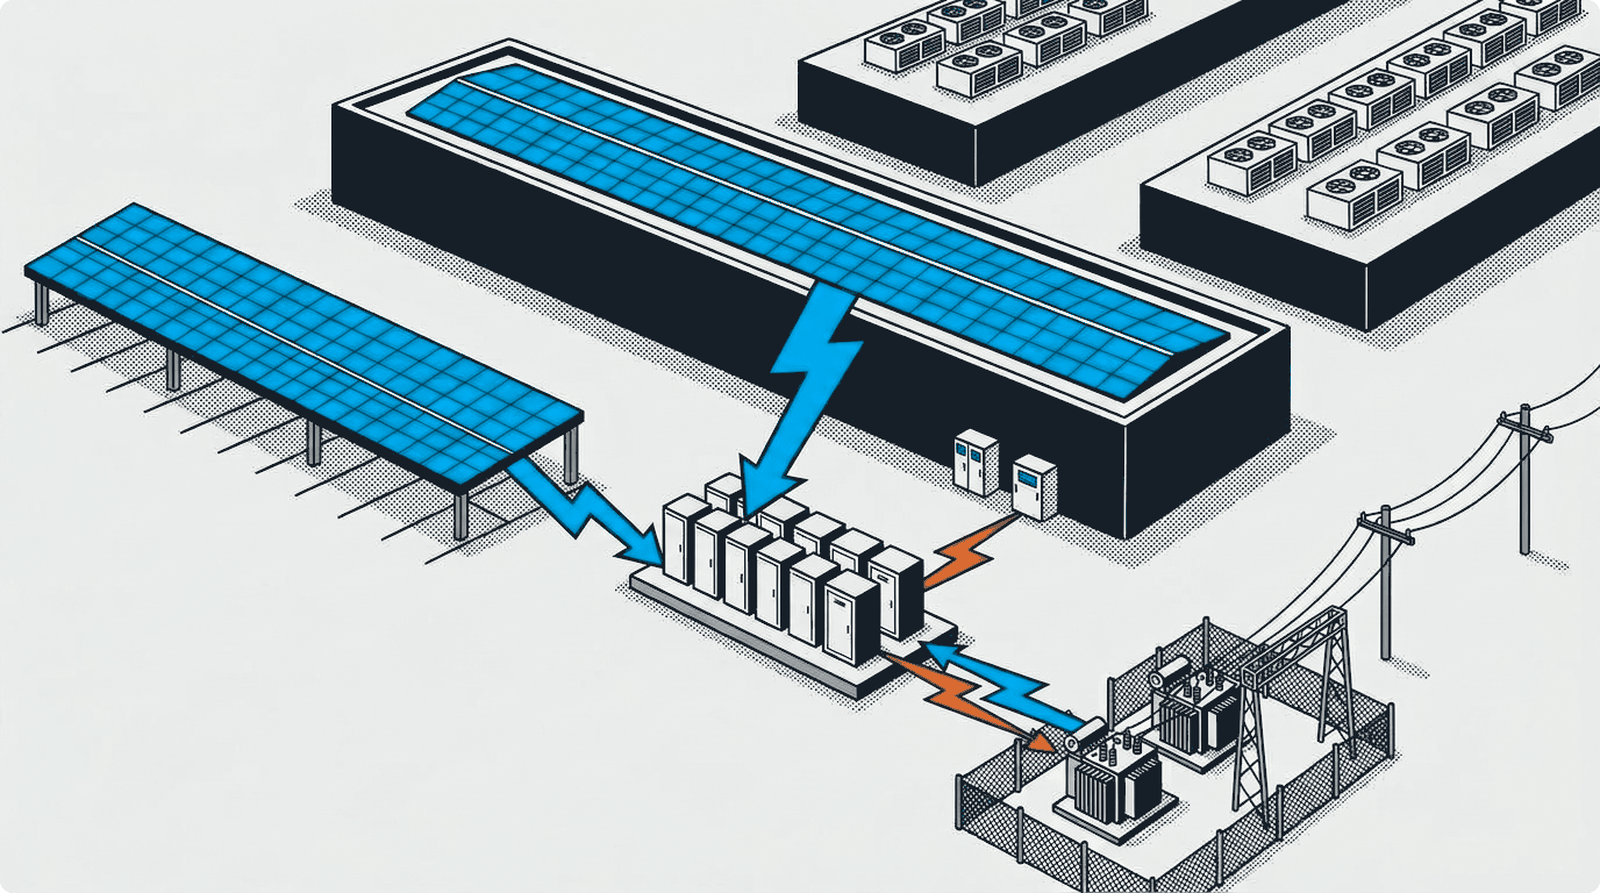
The first scenario is where data centers are built consistently. Larger, more powerful, and more prevalent than even planned. In that situation, there quite literally is not enough energy that can be provided for both society AND these data centers with the current grid. In order to maintain the status quo, for both data centers and society, massive diversification of energy methods would need to be used. Economically, clean energy is the only viable solution to meet this demand. While there would probably be more types of energy available to the market such as nuclear, more natural gas, and more traditional energy generation methods, it would only make clean energy more affordable because of the decentralized nature of the technology. Through periods of rapid growth, costs generally follow suit. The construction and management of a lot of these other methods usually take quite a long time to build (a luxury this scenario would not have) and take a lot of infrastructure (also something the US grid is not set up for). With the distributed energy approach of solar and battery, it enables this scenario to generate power more quickly, without needing massive infrastructure upgrades for each node on the grid to operate independently.
The second scenario is where the data center market contracts significantly. And, with the pushback of communities as well as the market already focused on smaller data centers, we believe this is more the case. A lot of companies used to keep their own server racks on site, inside their office. Even small businesses had this approach because it allowed them to own their infrastructure. In this approach, the need for on-site power generation and storage becomes paramount due to the need for uptime (one of the things that data centers take extremely seriously). Relying on an aging grid and variable rate structures creates instability both from a reliability standpoint and a financial one. However, owning your energy infrastructure, and decentralizing it with solar and battery, is the most cost effective way to ensure a more predictable energy cost. And, now and if even more adopt clean energy, the cost of producing energy assets would continue to decrease to a point where energy is freely abundant. This is the future that most people would like. However, this can be achieved with either scenario playing out. One just takes a lot more time to arrive at the same place.
California (and MYNT) has already been getting ahead of this.
We decided to look a bit into how California has been preparing for the energy demand that would inevitably increase. The numbers were more illuminating than we thought, despite building these assets since 2014. According to the numbers from US Energy Data, a public-good project from the Institute for Progress that pulls the EIA’s state filings, storage capacity has greatly increased in the past 5 years, most likely related to AI and data centers. But what we found puzzling was retail consumption of energy… it decreased.
What this tells us is that the demand for energy, while constantly increasing, was shaped differently. With solar taking up much more of the energy generation, and being able to store it, that energy can be distributed at the right times (when the sun goes down).
What this doesn’t account for is the new demand for new data centers. This is putting pressure on the generation AND the storage at the same time. It’s a significant challenge, but battery storage and clean energy as a whole is proving to be remarkably scalable in reaching demand within a much tighter timeframe. California has a further 9,022 MW of storage planned through 2028. And Texas, which is where a great deal of the new data center construction is actually going, has 23,988 MW planned over the same window, which tells you what the people building those campuses have concluded about how to power them.
Clean energy is objectively the future of energy. It is simply a better way to approach energy. That is not to knock the progress that has got us here. The innovators who even conceptualized energy, and the processes that we developed throughout history to harness the power of naturally occurring substances and process them into the world that we have today is remarkable. But, we are at a point in history where the playbook is being rewritten. And, for us at MYNT, we are writing in batteries, solar, VPPs, and clean as the new playbook.
California figures: US Energy Data (2026), California, Institute for Progress, usenergydata.org/states/california underlying data US Energy Information Administration (2026) via US Energy Data, Forms EIA-860, EIA-860M and EIA-861 charts redrawn from that data under CC BY-SA 4.0.
Additional sources: IEA Lawrence Berkeley National Laboratory Epoch AI BloombergNEF CAISO MYNT project modelling.