Renewable energy economics makes so much sense now, it sometimes makes it harder to sell.
With paybacks that are usually below six years for most projects, we find ourselves more in the position of education because people, quite frankly, don't believe the numbers are real. So, this is how the economics of a project actually work.
Time and time again we've had clients react to our feasibility study with a lot of questions. Most are that, even with the assumptions, why is the payback time so short? We've come to realize that this is our mistake rather than theirs, because we were showing them a conclusion and simply asking them to trust it when they've been taught to believe there is no free lunch.
So, we decided to be transparent about what a battery project (with solar) would cost. We also wanted to be conservative with the model so most of the actual projects that we end up building are even better than this.
About this model
The project below is a real project, anonymized. There are a few things to keep in mind when looking at this example. Your rate schedule, your load shape, your utility, and your roof can move these numbers, and a feasibility study that we create for a specific building will be accurate to that specific building. Utility bills are often shared with us during this process. However, we find that even without these, our margin of error is in the single digits.
Why do people not trust the numbers?
It is worth saying plainly that skepticism about energy savings projections is well founded. The clean energy industry has a long history of models built on optimistic escalation rates, production estimates nobody stress-tested, and incentive assumptions that didn't actually pan out. We've been at this a while so our numbers, and escalation rates, are based on historical data.
The four components that changed how good the economics look
Time has been the best friend of the entire industry. Over the last decade, renewable energy costs have dropped aggressively. This is mostly due to innovation in manufacturing but is also aided in the growth of the industry as the whole. As more entrants come to the market, and the customer market grows, the more affordable the entire industry becomes.
Batteries became super affordable. This is the biggest mover in the past decade. Cell and pack costs have fallen by roughly an order of magnitude over the last decade. We often talk about energy in the form of generation, storage, and distribution. The generation costs, through solar, have been steadily decreasing. But the battery was the harder problem to solve due to the battery chemistry innovation needed and the manufacturing needed to meet demand. Thankfully, that problem is mostly solved and will only continue to improve as time goes on.
Tax credits are still a thing and it is even better with batteries. The investment tax credit starts at 30% and stacks adders on top for domestic content and for projects sited in energy communities. Storage now qualifies on its own rather than only when charged by co-located solar, which was a previous rule that used to force awkward system designs. The model below uses 40%, which is achievable (especially with massive recent investments in US-based battery manufacturing) but is not the ceiling of savings.
NEM 3.0 made storage arguably more important than solar. When exported solar earned close to retail, a battery was a nice-to-have. Under the current export rates, the value of solar depends almost entirely on whether you can hold it until peak-priced evening hours. That change hurt solar-only projects and it is precisely why solar plus storage now pencils where neither did before.
Batteries can produce savings but can also generate revenue, which is massive. Demand charge reduction, energy arbitrage, and now VPP-based capacity and grid services, are all ways that batteries can make sense in an energy strategy. We wrote about VPPs in another article and it is the newest benefit that most people leave out of their mental model entirely.
Now, the project
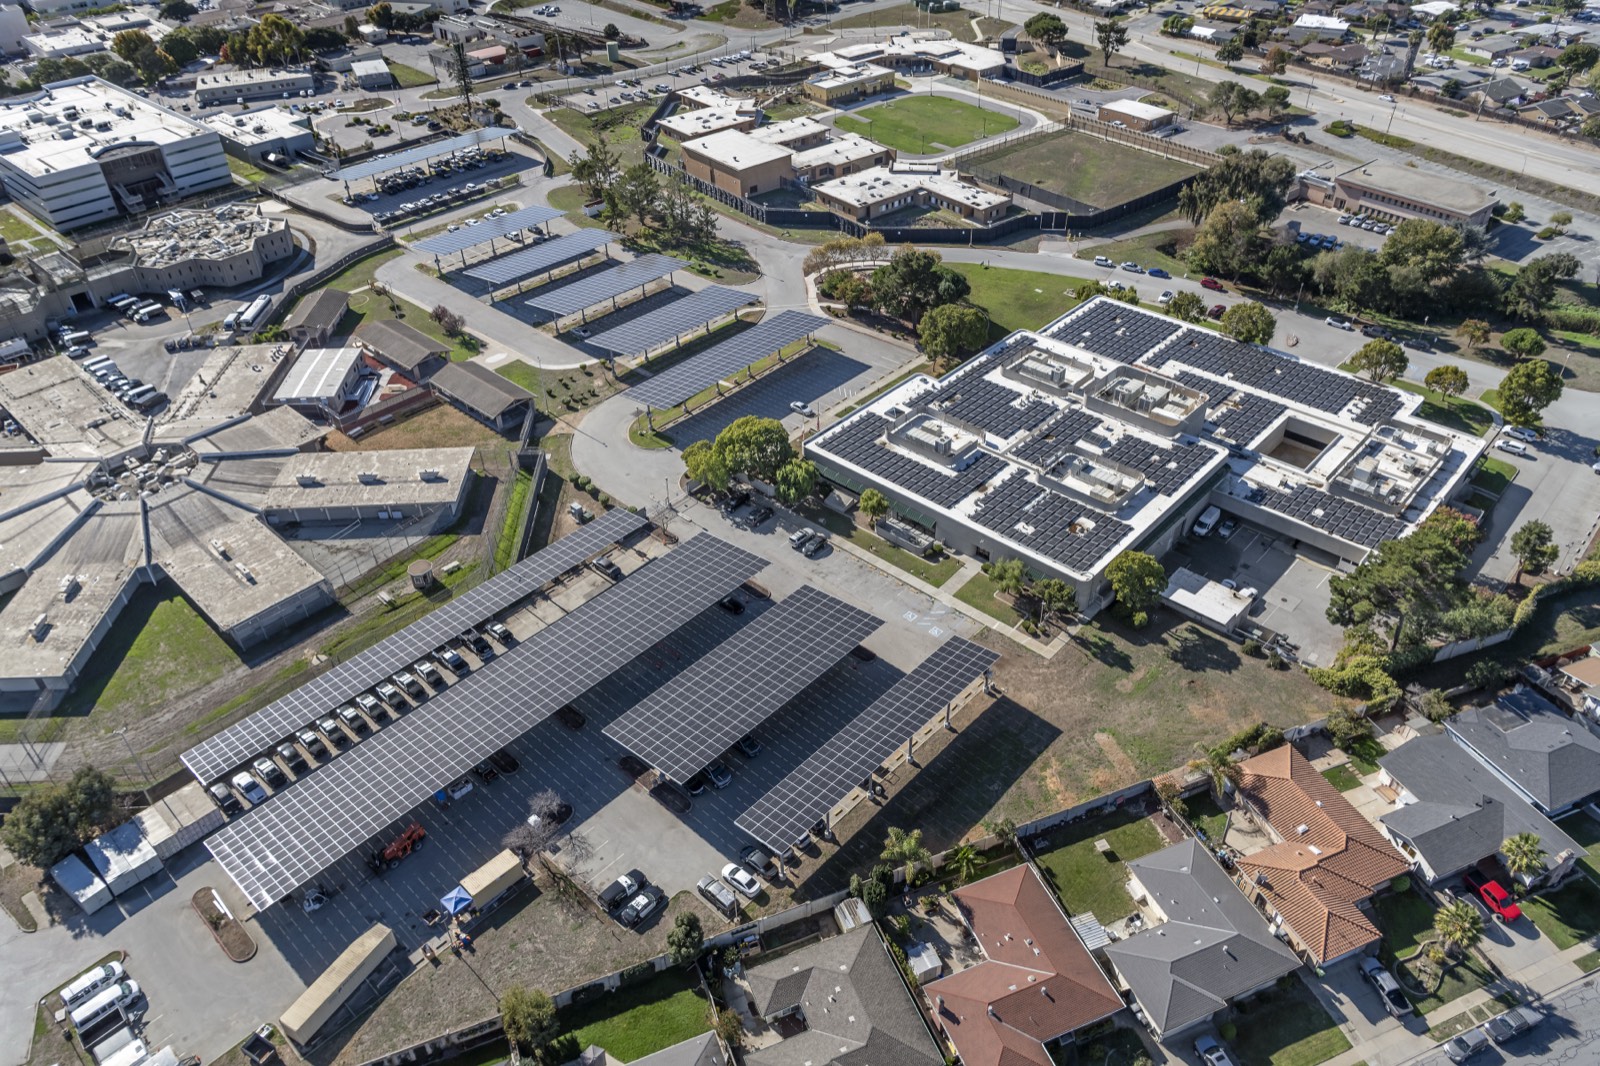
Here's what we're working with: a commercial and industrial site in California, with 1.2 MW of rooftop and carport solar paired with a 1 MW / 2 MWh battery. Everything below is year-one project related economics, unless stated.
| 1 MW / 2 MWh | 2 MW / 4 MWh | |
|---|---|---|
| Installed cost | $3,600,000 | $6,500,000 |
| Federal ITC at 40% | −$1,440,000 | −$2,600,000 |
| Depreciation benefit, net present value | −$580,000 | −$1,050,000 |
| Net cost | $1,580,000 | $2,850,000 |
| Demand charge reduction | $172,000 | $344,000 |
| Energy and time-of-use | $212,000 | $424,000 |
| Grid services and capacity | $67,000 | $148,000 |
| Year-one return | $451,000 | $916,000 |
| Simple payback | 3.5 years | 3.1 years |
What do each of these energy line items mean?
Demand charge reduction, $172,000. Commercial bills in California are not tied solely to your energy usage. They are also a charge based on your single highest fifteen-minute draw across the whole month. So if you think about turning on machinery and draw a lot of power for as little as 15 minutes, you are paying a higher rate for the entire month. A battery that discharges into those peaks lowers a number that has nothing to do with how much electricity you actually used. This is the most reliable line in the model, because it depends on your own load rather than on any market.
Energy and time-of-use, $212,000. This is really just your solar production offsetting consumption, plus the battery moving energy out of expensive hours. This line is sensitive to your rate schedule and to how much of your load sits in the evening peak.
Grid services and capacity, $67,000. This is the newest line item so, while a bit more uncertain, it is something that is coming soon, if not already here depending on where your site is. Today, these are limited to programs like DSGS; from 2027 on it will increasingly include wholesale market participation. Even if you removed this line entirely, payback moves to roughly 4.1 years, which is still insane economics.
Why a bigger battery can actually be much better
Doubling the system size does not double the cost, because a meaningful share of a project is essentially fixed: the interconnection study, switchgear, design, permitting, mobilization, commissioning. Spreading those across twice the capacity takes installed cost per kilowatt from roughly $3,000 to about $2,700, and that alone moves payback by nearly half a year.
Grid services scale better with capacity as well, because a larger resource clears market thresholds that a smaller one gets stuck under. If you are sizing a system to your current load and there is roof or parking left over, the marginal capacity is usually cheaper than the capacity you already agreed to buy. And given the opportunity that we have in front of us of energy being accessible, more is usually better in this case.
What could bring these numbers down? What's the worst case scenario?
The worst case scenario is 99.99% better than just sticking with the status quo. But at the same time, it's best to be aware of what could affect these project economics.
Your tax position. The ITC and the depreciation benefit are together 56% of the gross cost in this example. We rarely see a case where a company does not qualify for ITC, but edge cases do exist. However, we explore this in the due diligence phase of the project so that way we know everything up front.
Your load shape. The demand charge line assumes peaks a battery can actually reach. A site with a flat, unremarkable load profile doesn't have as much savings as one that has peaks in their energy usage. However, since we primarily work in the commercial and industrial sectors, most companies are surprised to find out that they have peaks in their energy usage that they weren't aware of.
Interconnection. Getting your project hooked up to the grid is the thing that can change the economics a bit. We've worked with all the major utilities, and we know what will usually get approved, but an interconnection study can require utility-side upgrades that can add cost to your balance sheet and extend the project timeline. This is solved pretty simply by a site visit that we usually do.
Rate design. Sometimes, one of the biggest impacts is simply a rate change with the utility. In addition to building projects, we also try to find as much efficiency simply on the billing of your energy usage. But the one thing that we don't have control over is the rate escalation of the utilities. To be honest, the utilities don't have control over this either. It is purely based on the cost to maintain the grid and also meet the demand of energy for customers. We can forecast up to 25 years ahead while also looking back historically to see the pace of rate escalation. For sake of math, it's safe to assume around a 2 to 4% yearly escalation rate in California.
So if everything were to go sideways, and we mean sideways, you are still looking at less than 7 years. This is why clean energy makes so much sense now and why we are so passionate about this.
You're investing in a dynamic system
If you take a step back from the nitty-gritties, an interesting picture begins to emerge.
Solar creates cheap energy at the wrong time of day. Storage moves it to the right one, which is what rescues solar under current export rates. Once storage is on site, it turns out to be capable of two more things, cutting your demand charges and supporting the grid during peak demand.
The grid wants to pay for batteries and distributed energy because it is genuinely cheaper, and much more in line with California's emission goals, than building peaker plants and substations for a few dozen hours a year.
What may look up close like a suspiciously good payback is, from further back, just what it costs to build a cheaper, cleaner, more reliable grid that benefits everyone. Those who invest in projects like the one we've modeled here are arriving at just the right time in history.
Do you have to own the system?
Not at all. Yes, if you have the capital and want to own the system, you would reap the benefits of the tax credits as well as all of the economics that get layered on top of it. But, if you decide not to own it, you still get the savings of energy, a stabilized energy bill, and can reinvest that capital in your business. The payback may extend slightly by not owning the system, but it is still massively more advantageous than paying an energy bill that you have no control over. You are really only sacrificing the years of positive revenue after the payback. Neither answer is right, but merely options on the table. And that too is another magical part about clean energy, optionality.
Sources: MYNT project modelling BloombergNEF CPUC PG&E and SCE commercial tariffs. Reference case anonymized and adjusted.